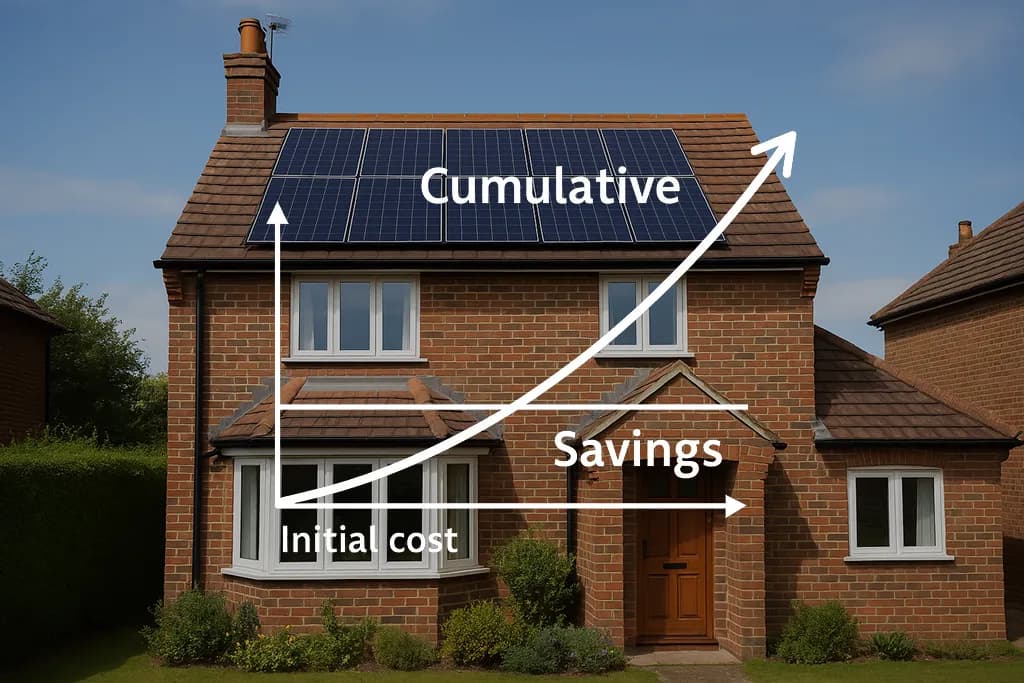
Are Solar Panels Worth It in Scotland? Cost and Payback in 2026
The Energy Saving Trust puts solar payback in Stirling at 11–12 years. What a system costs in Scotland, the sums at October 2026 prices, and a calculator for your own figures.
JME Green Energy
JME Green Energy Team
You'll often see solar payback quoted at seven or eight years. The independent figure for Scotland is longer, and this page starts from that figure.
⚡ Key Takeaways
- The Energy Saving Trust puts solar payback in Stirling at 11–12 years, the longest of the UK locations it models (fuel prices as of July 2026).
- A typical 4.5 kWp system costs about £7,600 as a UK benchmark. Government figures for Scottish 4–10 kW installations averaged £1,578 per kW in 2025/26, about £7,100 for 4.5 kWp as an illustration, not a quote.
- Our worked example at October 2026 prices pays back in 11.0 years. On a 4.1p export rate instead of 12p, the same system takes 13.9 years.
- A battery costs £5,000–£8,000. In our example it raises the yearly saving but stretches total payback to 14.9 years.
All figures below were checked on 6 October 2026. Each one shows its source and the date that source published it or last updated it. Those dates are not the same as the date we checked them.
The benchmark: 11–12 years in Stirling
The Energy Saving Trust (EST) publishes payback periods for a typical home solar system in four places. Stirling, which is where we work, has the longest:
| Location | Payback with export payments |
|---|---|
| Stirling | 11–12 years (11 if someone is home all or half the day, 12 if out all day) |
| Manchester | 10–11 years |
| Aberystwyth | 9–10 years |
| London | 9 years |
Source: Energy Saving Trust, solar panels guide, page last updated 1 October 2026. Paybacks include export payments and use fuel prices as of July 2026.
What sits behind those figures:
- A typical system: EST describes domestic systems as generally around 4.5 kWp and costing about £7,600. That is a UK typical cost, not a Scottish one.
- Export payments are included. EST does not publish the export rate it assumes, so we do not quote one on its behalf.
- Fuel prices are an average, not today's cap. EST's data page (updated 22 September 2026) says it averages recent and projected Ofgem caps. It lists 24.7p/kWh for standard-rate electricity in Great Britain.
- It is a simple payback: cost divided by yearly saving. EST's own data page warns that this method leaves out maintenance, replacement parts, inflation, future prices and the lifetime of the system.
Why Scotland takes longer
Mostly it is less sunshine. The EU's PVGIS model (checked 6 October 2026) estimates about 876 kWh a year from each kWp of an unshaded, south-facing roof near Stirling. The same roof in London produces about 1,019. That is roughly 14% less electricity in Stirling from the same panels at the same price, so each pound of the system takes longer to earn back.
What solar panels cost in Scotland
There are two kinds of cost figure, and they are often mixed up:
- A UK benchmark applied to a Scottish home. EST's £7,600 for 4.5 kWp is the cost its Stirling payback is built on. It is a UK typical figure (EST, page updated 1 October 2026).
- Measured Scottish prices. The Department for Energy Security and Net Zero (DESNZ) analyses the installations in the MCS Installation Database that have valid cost data, broken down by region. For the 9,004 Scottish installations of 4–10 kW in that analysis for April 2025 to March 2026, the average cost was £1,578 per kW of total installed capacity (DESNZ, Solar PV cost data, published 28 May 2026).
Total installed capacity is the panels' rated output, which is what a "4.5 kWp" system size means. So as an illustration, 4.5 kWp × £1,578 comes to about £7,100. Read that with its limits: DESNZ labels this series "official statistics in development"; it is an average (mean) across a whole size band, from 4 kW up to 10 kW; it includes non-domestic installations as well as homes; and it is not a quote for your house.
The Scottish illustration comes out about £500 below the UK benchmark. At £7,100 instead of £7,600, the worked example below would pay back in 10.3 years instead of 11.0.
We don't publish our own prices on this page. Your price depends on your roof, so we give it to you after we've seen it.
What moves the price of a particular job:
- System size and kit. More panels, or higher-output panels, cost more in total but often less per kW.
- The roof. Several small roof faces, a steep pitch or awkward scaffold access all add labour.
- Electrical work. An older consumer unit sometimes needs replacing before solar can be connected.
- Certification. Export payments need MCS or equivalent certification accepted by your supplier (see below). Check what a cheap quote includes before you rely on export income.
Solar panels and batteries installed in homes currently pay 0% VAT, until 31 March 2027 (HMRC VAT Notice 708/6). The Home Energy Scotland grant and loan does not currently fund standalone solar panels or batteries. Our guide to solar grants and payments in Scotland covers the help that is available.
The worked example, step by step
Here is the calculation for a typical Scottish home. Several of the inputs are illustrative assumptions, and they are labelled as such.
| Input | Value and source |
|---|---|
| System size | 4.5 kWp (EST typical system, page updated 1 October 2026) |
| Installed cost | £7,600 (EST UK benchmark, page updated 1 October 2026) |
| Generation | 800 kWh per kWp a year, so 3,600 kWh. Illustrative: between PVGIS's ~876 (south-facing) and ~688 (east-facing) for Stirling |
| Electricity price | 26.32p/kWh, the Ofgem cap for 1 October to 31 December 2026 (GB average, Direct Debit, announced 26 August 2026) |
| Share used at home | 50%. Illustrative: someone is home for part of the day, no battery |
| Export rate | 12p/kWh (Outgoing Octopus, checked 6 October 2026, needs Octopus as your supplier) |
- Generation: 4.5 kWp × 800 = 3,600 kWh a year.
- Bill saving: you use half, 1,800 kWh, instead of buying it at 26.32p. That saves £474 a year.
- Export income: the other 1,800 kWh is exported at 12p, which earns £216 a year.
- Total benefit: £474 + £216 = £690 a year.
- Payback: £7,600 ÷ £690 = 11.0 years.
That lands inside EST's 11–12 years for Stirling, from inputs we chose separately. Two cross-checks:
- At EST's averaged electricity price of 24.7p instead of today's cap, the same example takes 11.5 years.
- If the house is empty during the day and you use 40% rather than 50%, it takes 11.9 years, which is close to EST's 12 years for "out all day".
A note on October electricity prices
The 26.32p rate applies from 1 October to 31 December 2026. It has no VAT in it, because the government has removed VAT from household electricity bills from 1 October 2026 to 31 March 2027 (Ofgem, 26 August 2026). The cap is a Great Britain average, so rates vary by region and by tariff. Ofgem resets the cap every three months, and the next level is due to be announced by 25 November 2026. Every unit you use from your panels is worth whatever you would otherwise have paid for it, so a rise in the cap shortens payback and a fall lengthens it.
Work out your own payback
Solar payback calculator
It starts on the worked example above. Swap in the figures from your own quote, roof and tariff.
Example: Energy Saving Trust's typical 4.5 kWp system, £7,600 (page updated 1 October 2026). UK benchmark, not a quote.
On your quote, in kWp (kilowatts peak).
Example: 800. PVGIS gives about 876 for an unshaded south-facing roof near Stirling and about 688 facing east.
Example: Ofgem cap, 1 October to 31 December 2026, 26.32p/kWh (GB average, Direct Debit, no VAT). Use the unit rate on your bill.
Illustrative. Higher if someone is home in the day; lower if the house is empty 9 to 5.
Checked 6 October 2026. 12p/kWh: Outgoing Octopus, needs Octopus as your electricity supplier. 4.1p/kWh: Octopus SEG tariff, open to export-only customers on any supplier.
Worked example result
11.0 years
- Generated a year
- 3,600 kWh
- Total cost
- £7,600
- Bill saving (1,800 kWh used)
- £474/yr
- Export income (1,800 kWh)
- £216/yr
- Total benefit in year one
- £690/yr
Simple payback: cost divided by year-one benefit. It leaves out inverter replacement, maintenance, panel degradation, battery storage losses, future price changes and the cost of borrowing. An illustration, not a quote.
What changes the answer
1. How much of your solar you use yourself
This matters more than anything else you control. Each unit you use saves you the full import price (26.32p today). Each unit you export earns the export rate, which is usually far less. A household that is home during the day, or runs the washing machine, dishwasher or EV charger while the panels are generating, uses more of what it makes.
2. Your export tariff
The Smart Export Guarantee (SEG) means larger suppliers have to offer some export rate. They decide what it is. Rates we checked on suppliers' own pages on 6 October 2026:
- 12p/kWh: Outgoing Octopus. This is a variable rate and needs Octopus as your electricity supplier.
- 4.1p/kWh: Octopus SEG tariff. This is a fixed rate, open to people who keep a different supplier for their electricity.
We use Octopus for both only because it publishes both kinds of rate on its own site. Other suppliers have tied and open rates too, so compare several. In our example, the export rate alone moves payback from 11.0 years at 12p to 13.9 years at 4.1p. Before you sign up, check whether a better export rate means a worse import tariff.
To get SEG payments you will usually need MCS or equivalent certification accepted by the supplier, and a smart meter that records your exports (EST, page updated 20 May 2026). Payments don't start automatically, so you have to apply. Our guide to selling solar back to the grid explains how.
3. Your roof
A south-facing, unshaded roof near Stirling makes around 876 kWh per kWp a year according to PVGIS. Facing east, the figure is closer to 688. East–west roofs can still work well because they spread generation across the day, but expect less from each panel. Shade from trees or chimneys reduces output further.
4. Adding a battery
A battery stores daytime solar so you can use it in the evening. That raises the share you use yourself. It also adds £5,000–£8,000 to the cost (EST, page updated 1 October 2026), and it does not automatically shorten payback.
In the worked example, adding a £5,000 battery and assuming it lifts your own use from 50% to 80% (an illustrative figure, which ignores the energy lost charging and discharging the battery):
- Total cost rises to £12,600.
- The yearly benefit rises from £690 to £844: £758 in bill savings and £86 in export.
- Total payback goes from 11.0 years to 14.9 years.
The battery adds about £155 a year on its own. Earning back £5,000 at that rate would take over 30 years. A battery is worth more when your export rate is low, because the units it saves would otherwise be sold cheaply. On the 4.1p export rate, the same battery adds about £240 a year, but total payback is still longer: 16.0 years with the battery against 13.9 years without.
This illustration ignores storage and conversion losses: some energy is always lost going into and out of a battery, so real savings would be slightly lower than shown. It also leaves out where a battery can earn its keep. A battery can charge from the grid on a cheap overnight or time-of-use tariff and power your home at peak times. It also helps if you have, or plan to have, an EV or a heat pump. None of that is modelled here, and it depends heavily on the tariff. Our battery storage page covers when one makes sense.
So, are solar panels worth it in Scotland?
For many homes, yes, but over a long horizon, and a seven-year payback is not a realistic expectation here.
EST expects panels to last 25 years or more. On an 11–12 year payback, that leaves a long stretch after the system has paid for itself. EST also notes that the inverter usually needs replacing after around 12 years, which falls close to the payback point and is not included in any figure above (EST, page updated 1 October 2026).
Solar is more likely to be worth it if:
- your roof faces roughly south, east or west, with little shade;
- someone is home during the day, or you can move appliance use into daylight hours;
- you plan to stay in the house for well over a decade;
- you can get a decent export rate without paying more for your electricity.
It is less likely to be worth it if the roof is heavily shaded or faces north, if the roof itself needs replacing soon, or if you expect to move in the next few years.
What this calculation doesn't include
Treat every figure here as a guide, not a forecast:
- Prices change. The example uses today's Ofgem cap and today's export rates. Neither is fixed for the life of the panels.
- Panel output declines slowly over the years, and the weather varies from one year to the next.
- Inverter replacement and maintenance aren't counted.
- Borrowing costs aren't counted. If you finance the system, the interest lengthens payback.
- Self-consumption shares are illustrative. Your real figure depends on your household. The battery's 80% is an assumption, not a measurement.
- Battery losses are ignored. The battery example treats every stored unit as fully recovered. Real batteries lose some energy charging and discharging.
- Cost figures are averages. The Scottish figure is a mean across all 4–10 kW installations, including non-domestic ones. Your quote can be higher or lower than either figure.
Solar payback in Scotland: common questions
Sources and dates
All checked on 6 October 2026. The date in brackets is when the source published or last updated the figure.
- Energy Saving Trust, Solar panels (page updated 1 October 2026; paybacks use fuel prices as of July 2026): typical system size and cost, battery cost, Stirling and UK payback periods, panel and inverter lifetimes.
- Energy Saving Trust, How we calculate our energy saving data (updated 22 September 2026): fuel-price method, 24.7p electricity average, limits of simple payback.
- Energy Saving Trust, Smart Export Guarantee (updated 20 May 2026): SEG eligibility.
- DESNZ, Solar photovoltaic (PV) cost data (published 28 May 2026, covering April 2025 to March 2026): Scottish 4–10 kW installation costs, from the Total Installed Capacity workbook, Regional costs table ("official statistics in development").
- Ofgem, Changes to energy price cap between 1 October and 31 December 2026 (published 26 August 2026): 26.32p/kWh electricity and VAT removal.
- EU Joint Research Centre, PVGIS (SARAH3 solar data, 2005–2023; run on 6 October 2026): generation for Stirling and London.
- Octopus Energy, Outgoing Octopus and Octopus SEG tariff (rates as shown on 6 October 2026): export rates and conditions.
- HMRC, VAT Notice 708/6: 0% VAT on residential solar and batteries until 31 March 2027.
Want a payback figure for your own home?
We'll look at your roof, your yearly electricity use and your tariff, then give you a costed design and a payback estimate based on your numbers rather than an average. It's free and there's no obligation.
Book a free solar assessmentWant to know what the installation involves first? Read about our solar panel installation service.
Related Articles
Home Battery Without Solar: When Does It Make Sense?
Yes, a home battery works without solar. Charge at cheap overnight rates, run your home at peak times. The real costs, p...
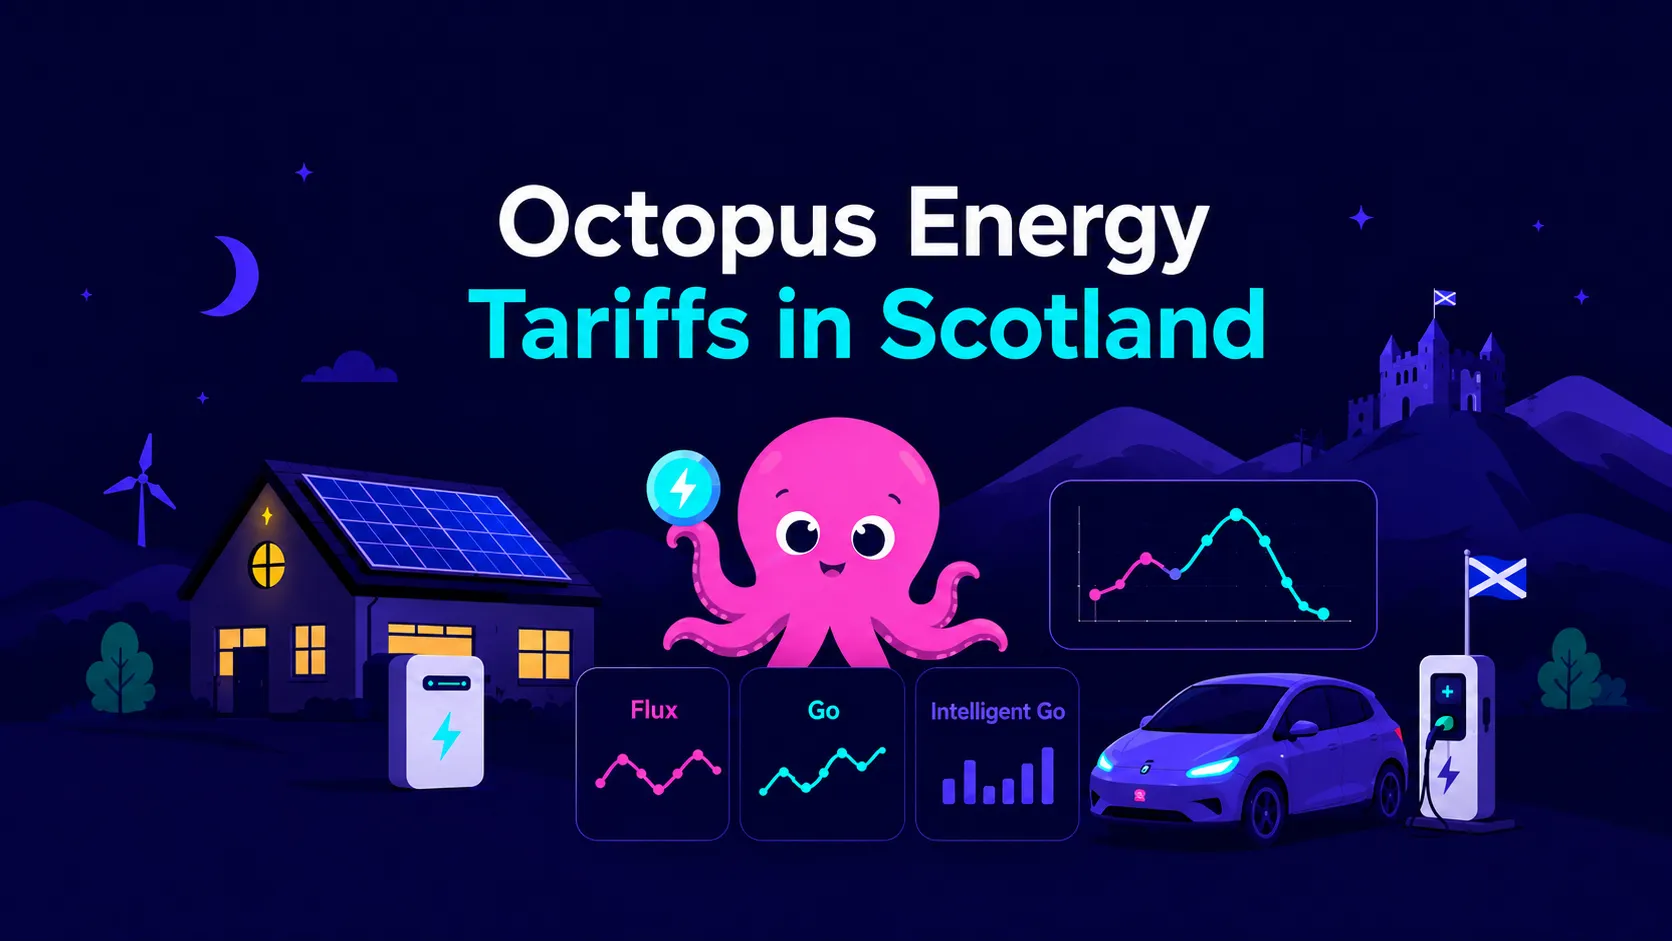
Octopus Energy Tariffs in Scotland (2026): A Plain-English Guide for Solar, Battery and EV Homes
Flux, Go or Intelligent Go? A plain-English guide to picking the right Octopus tariff for Scottish homes with solar, a b...
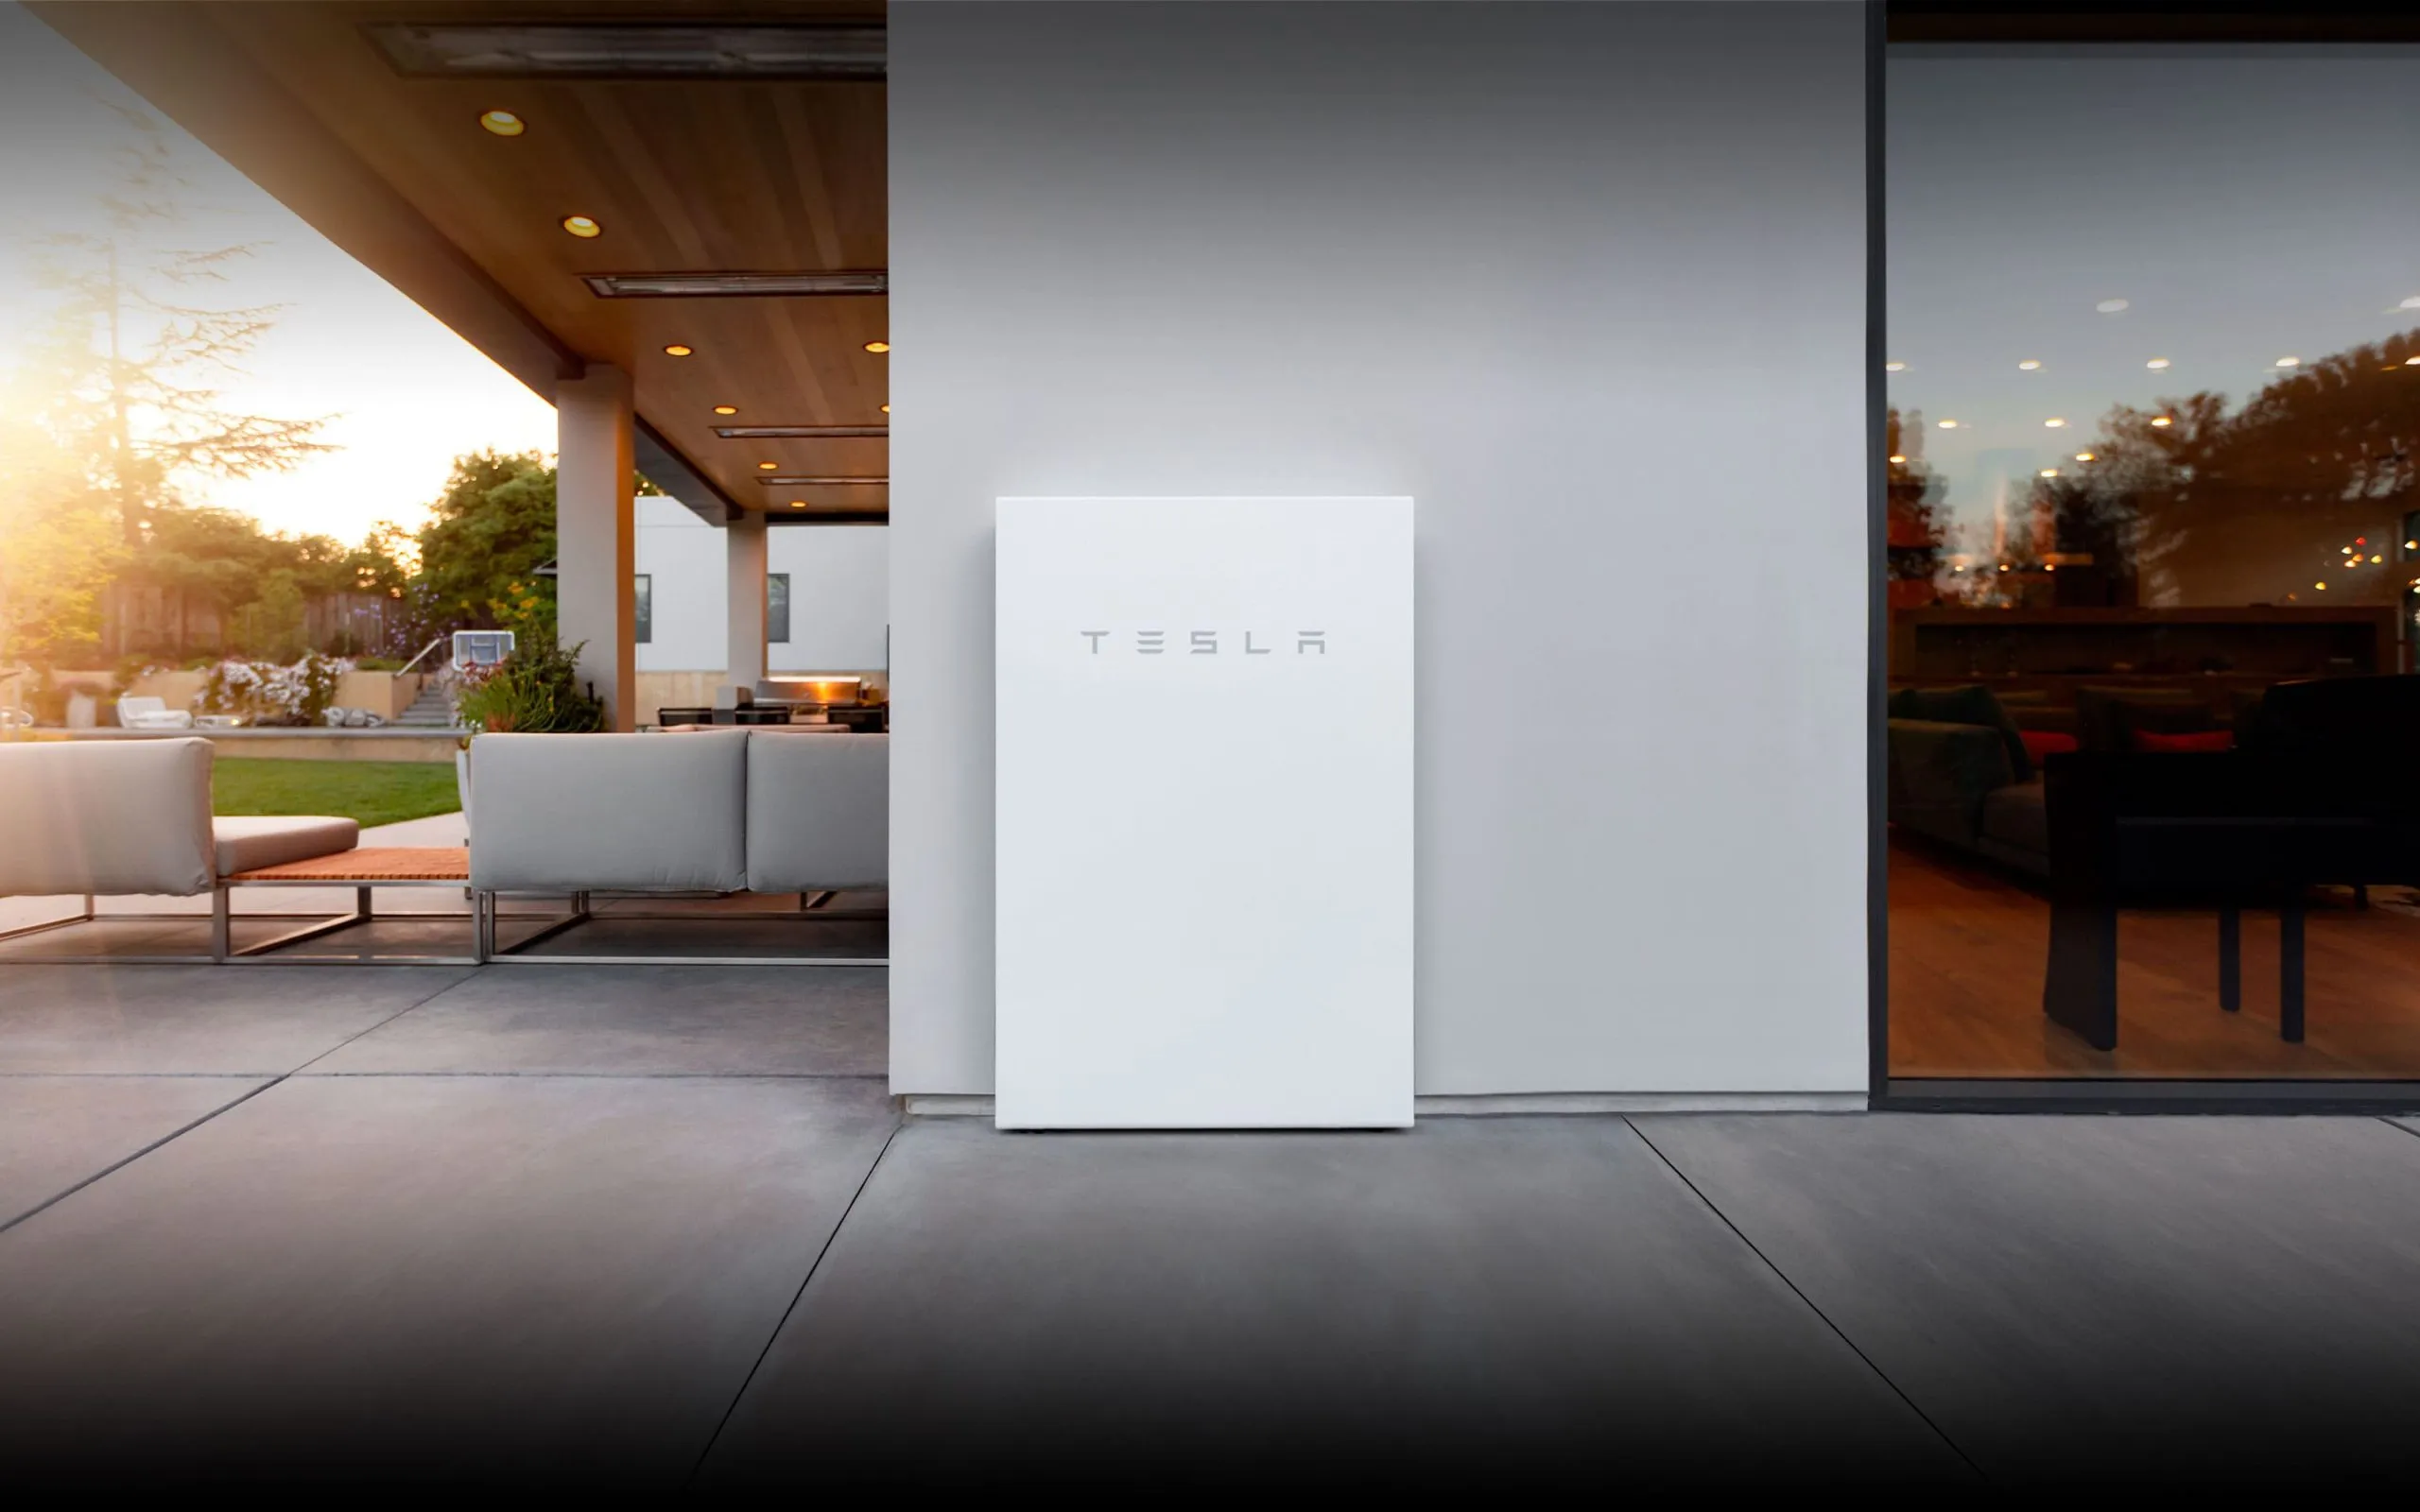
0% VAT on Home Batteries: What It Means for You
Installed home batteries pay 0% VAT until 31 March 2027, then 5%. What that saves on a £5,000–£8,000 battery, and what a...